Class of 2022: By the Numbers
On Aug. 24, most members of Yale’s class of 2022 walked through University gates for the first time. The new first-year class set records for socioeconomic diversity and yield.
To learn more about the class of 2022, the News sent out a survey to the first years in August. The results offer insights into the opinions, interests and goals of the newest class of Bulldogs. Of the 1,578 new first years, 864 responded to the survey — a 54.75 percent response rate. Survey results were not adjusted for selection bias.
“No matter where you are from, or who you are, or your path to arriving here, now you are — among other things — a member of this community,” University President Peter Salovey said at the annual Opening Assembly Address. “You belong here. You are citizens of Yale.”
Who is the Class of 2022?
Yale’s class of 2022 is one of the most diverse in University history, with a record 47 percent of the class made up by U.S. citizens or permanent residents who identify themselves as members of a minority ethnic or racial group, according to public University figures. According to Dean of Undergraduate Admissions and Financial Aid Jeremiah Quinlan, the yield rate for the class of 2022 was 72.4 percent — which was the highest figure in 15 years, since the University eliminated its binding Early Decision program.
When respondents were given the option to list one or more ethnic backgrounds that they identify with, 9 percent identified as African or African-American, 18 percent as Asian-American and 14 percent as Hispanic-American. About 12 percent of respondents identified as Arab-American, Native American, Pacific Islander or South Asian.
Female respondents outnumbered male respondents by nearly 9 percentage points. Seven survey respondents identified as gender queer.
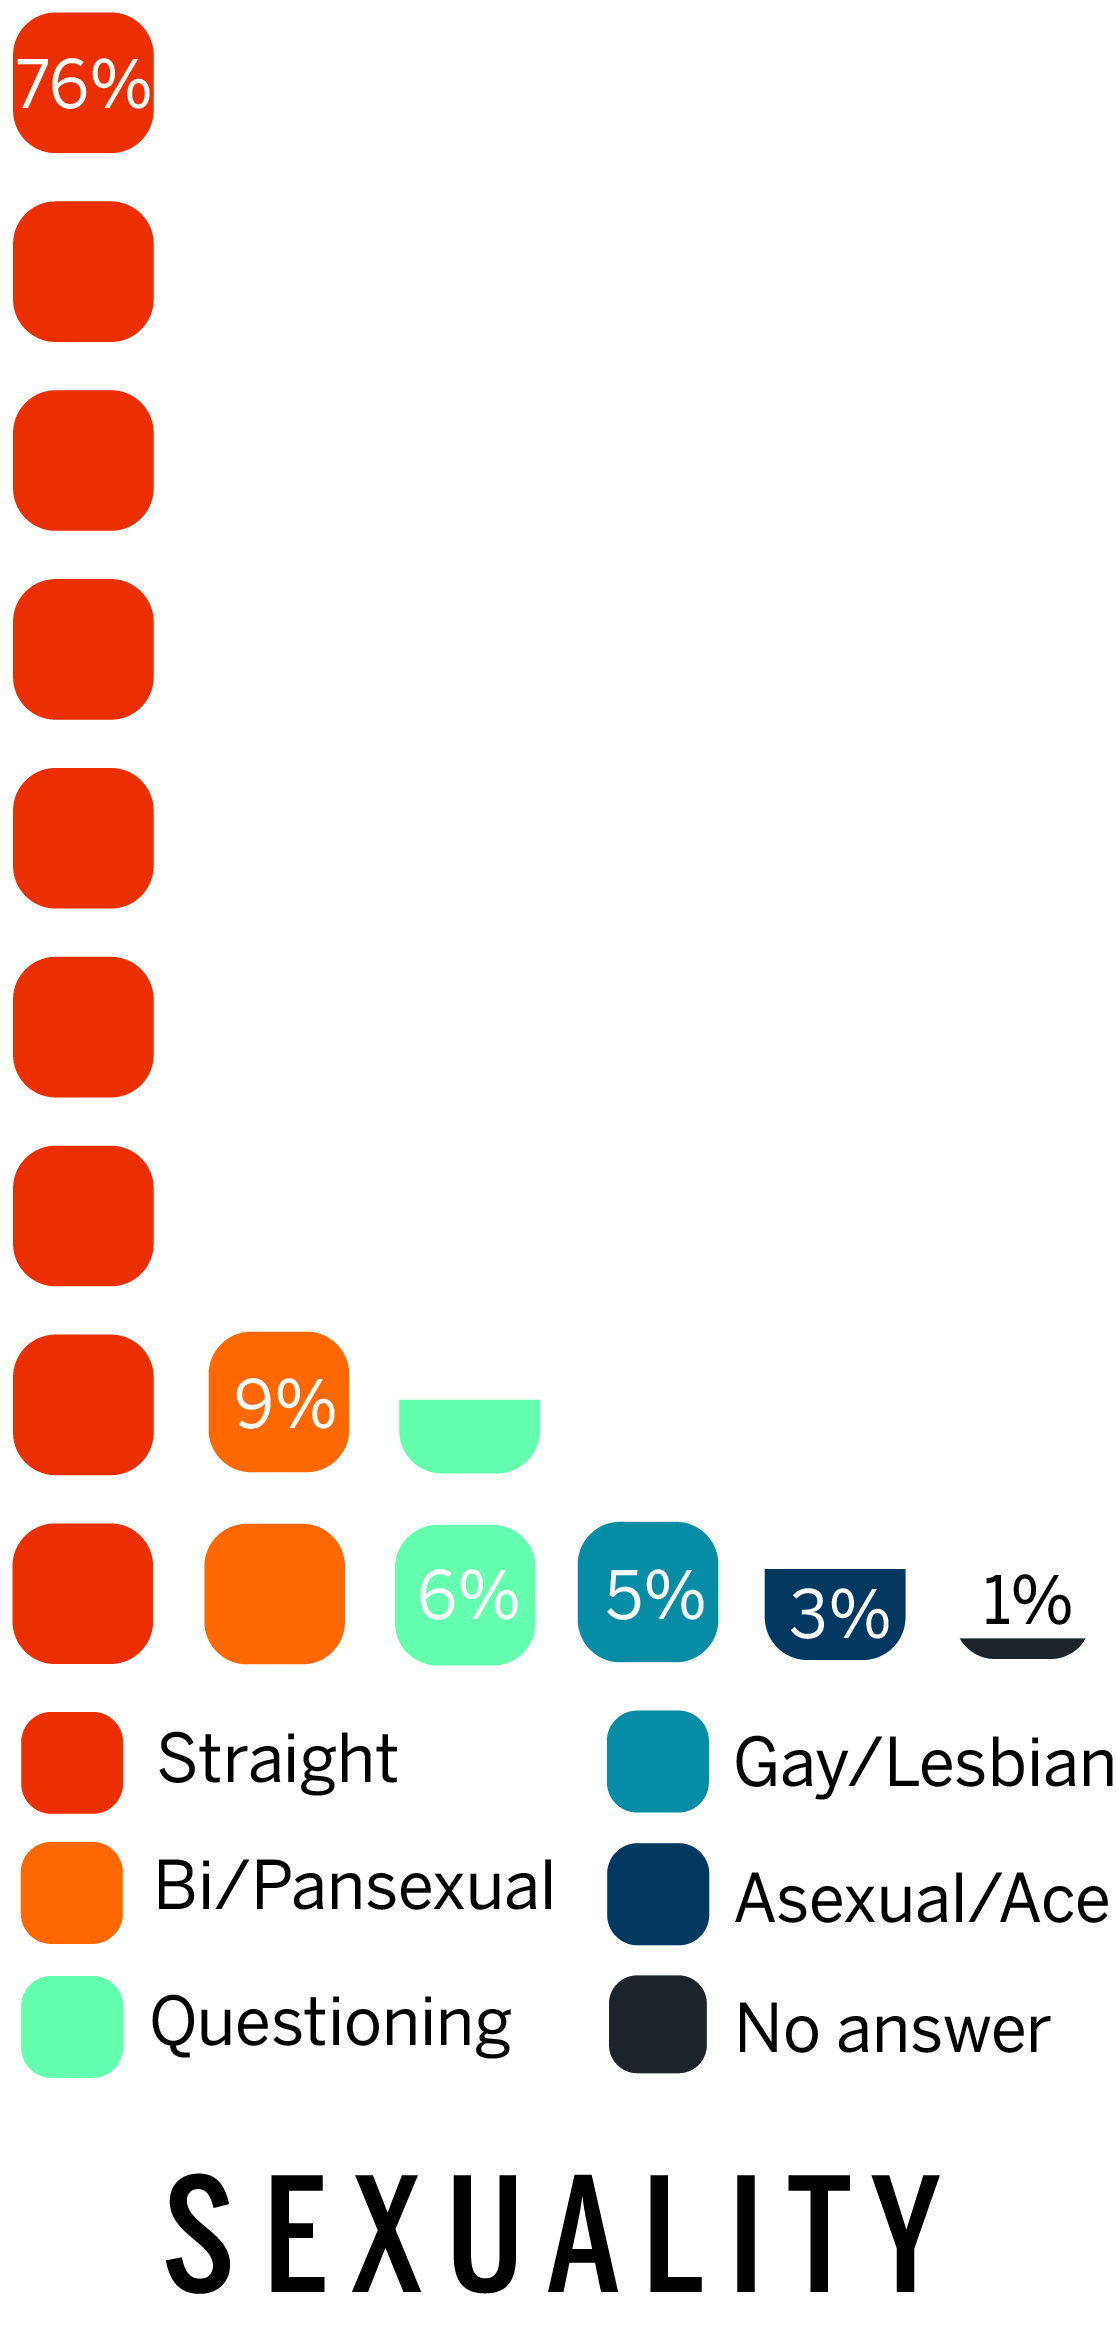
Around three-fourths of those surveyed identified as straight, while nearly 5 percent identify as gay and just over 9 percent as bisexual or transsexual. Three percent opted not to answer, and the remaining 8 percent identified as asexual, ace spectrum or questioning their sexual orientation.
A little over one-third of respondents hail from the northeast United States, while slightly under 17 percent are from outside the country. The majority come to New Haven from suburban communities, while only 29 percent and 10 percent hail from urban and rural areas, respectively.
Roughly 57 percent of respondents from the class of 2022 went to noncharter public schools, compared to almost 5 percent who attended charter schools, just over 26 percent who went to private schools and almost 11 percent who graduated from a parochial school. An overwhelming number of survey respondents said they felt extremely positive about their high school experience: Slightly over 80 percent rated their last four years as “good” or “very good.”
Twenty-three percent of respondents identified as agnostic, 16 percent as atheist, 16 percent as Protestant, 15 percent as Catholic, 6 percent as other Christian denominations, 10 percent as Jewish, 3 percent as Muslim, 3 percent as Hindu, 2 percent as Buddhist and 6 percent as other.
Andrew Bellah ’22 said that students are generally accepting of all types of faiths.
“I’m more just personally religious. I don’t attend church; I just read from my Bible,” Bellah said. “I don’t think it feels out of the ordinary. One of the things that comes with going to a very liberal school like Yale is that people let you do what you want to do.”
Students stress importance of strong financial aid
As cost of college education continues to increase nationwide, Yale has touted its continuing ability to offer need-blind admissions and need-based financial aid to students.
“Last year Yale was able to offer need-based financial aid awards to more incoming first years than ever before with the expansion of Yale College,” Scott Wallace-Juedes, director of undergraduate financial aid, told the News in March. “My colleagues and I look forward to working with the admitted students to the class of 2022 to ensure that cost of attendance is not a barrier for any admitted student when considering Yale.”
Three-quarters of respondents reported that financial aid was “very important” or “moderately important” in their college decision process. Only five percent ranked finances as “not important at all” in considering what university to attend.
Nearly 70 percent of respondents reported applying for financial aid at Yale, with fourth-fifths receiving some type of assistance from the University. Of those receiving financial aid, roughly 85 percent said they were satisfied with the assistance offered by the University.
Still, according to just over half of respondents, the cost of room and board at Yale — $15,500 — is too expensive. Slightly less than half reported that they intend to apply to an on-campus job, and only 12 percent said they decided against it. Nearly 40 percent said they were unsure.
Cleopatra Mavhunga ’22 said that she was somewhat frustrated about the financial aid process. She said that a lot of her family’s income goes overseas, which the financial aid office does not account for — and so was negatively surprised when she received her aid letter.
“For an immigrant family who came here for education, though, coming to Yale will hopefully pay off,” Mavhunga said.
Nearly 52 percent of respondents reported that the combined income of their parents or legal guardians was higher than $135,000. And of those, close to 13 percent said the combined income was higher than $500,000. Roughly 20 percent of respondents live in households with combined income of lower than $65,000. In last year’s class of 2021 survey, 15 percent of respondents said that they came from households making over $500,000 a year and just under 20 percent said that their legal guardians made less than $65,000 a year.
Just over one-fifth of respondents said that no one from their high school had attended Yale — to their knowledge. Around 19 percent are first-generation college students.
Alejandro Ortega ’22, a QuestBridge scholar and a first-generation college student said the transition into life at Yale has been relatively smooth.
“I haven’t had a negative experience,” Ortega said. “Obviously it’s a … transition from an environment where no one from my family has gone to college, when other people here say that their parents or their grandparents came here, so that can be difficult.”
According to Quinlan, a record 311 students in the incoming class — roughly 20 percent — are recipients of federal Pell Grants for low-income students. This is nearly double the number of Pell Grant recipients who matriculated just five years ago.
Students lean left
Nearly three-fourths of respondents identify as “very liberal” or “somewhat liberal.” While just over 16 percent said they were centrist, and almost 9 percent somewhat “conservative,” slightly less than 2 percent of respondents identified as “very conservative.”
These figures are consistent with previous News surveys. Roughly 75 percent of respondents from a survey profiling the class of 2021 described themselves as somewhat or very liberal. Sixteen percent identify as moderate, while only around 10 percent consider themselves somewhat or very conservative. These numbers also parallel those in a survey the News distributed to the entire student body in November 2016 in advance of the presidential election that fall.
Carson Macik ’22, a Texas native and self-described conservative, said that he was concerned about the cultural shock of coming to Yale. While Macik was concerned about his interactions with professors, he said that has found his fellow students more hostile.
“My professors have been very welcoming of discussing certain topics that wouldn’t otherwise be discussed,” Macik said. “But the student body is different, there are some students who I’ve run into where our conversations have quickly devolved into them yelling at me, and I just wanted to escape.”
How Yale compares
Yale’s acceptance rate of 6.31 percent is slightly lower than other Ivy League colleges. Harvard College offered a place in the class of 2022 to 4.59 percent of its applicant pool, or 1,962 of 42,739 applicants. Princeton offered admission to 5.5 percent of candidates, or 1,941 of 35,370 applicants.
Almost 75 percent of respondents said that Yale was their first-choice school. Of the quarter who had other first choices, the majority preferred Stanford, Princeton, Harvard and MIT.
Credits
Powered by