2021 by the numbers:
Introducing the class of 2021
On Aug. 25, Yale welcomed through its gates the largest and most diverse class in the College’s history, selected from the College’s largest ever applicant pool. The beginning of the class of 2021’s Yale career coincides with the opening of two new residential colleges, Pauli Murray and Benjamin Franklin — an expansion that, according to Yale College Dean Marvin Chun, allowed the College to “provide a Yale education to more of the most deserving students from all backgrounds than ever before.”
“The Class of 2021 will set the tone for a new Yale as they join with our students, faculty, and staff to harness the energy of expansion and growth,” Chun said in a press release.
To get a better sense of the character of this superlative-heavy incoming class, the News distributed a survey to incoming first-years earlier this month. The results from this survey shed light on the personalities behind these unprecedented numbers. One thousand, one hundred and forty-three students responded, yielding a response rate of 72 percent. The results were not adjusted for selection bias.
WHO IS THE CLASS OF 2021?
The survey reported a demographic breakdown of the class hailed as the most diverse in Yale’s history, with just under half of respondents self-identifying as Caucasian. Around 9 percent identified as African, Afro-Caribbean, or African American, and 25 percent described their ethnic background as East or South Asian, a slight increase from last year’s survey. Less than 12 percent of survey-takers identified as Latinx or Hispanic American, and Pacific Islander, Native American, and Middle Eastern first-years composed 4 percent of respondents.
Female respondents outnumbered their male counterparts by about 10 percentage points. Additionally, about 1 percent of students who took the survey identified as transgender, genderqueer or another identity outside of the gender binary.
Around three quarters of freshmen identified as straight, about 9 percent as bisexual or pansexual, and 7 percent as gay or lesbian. Some members of the class of 2021 also identified as asexual, ace spectrum or questioning their sexual orientation, with these respondents totaling to about 5 percent of respondents.
The majority of respondents hail from suburban communities — 59 percent — while 34 percent come from urban communities and nearly 8 percent come from a rural area.
At home, 84 percent of students speak in English. For those who reported speaking a different language in their home, commonly cited languages included Spanish, Japanese, languages of China, Hindi and Russian.
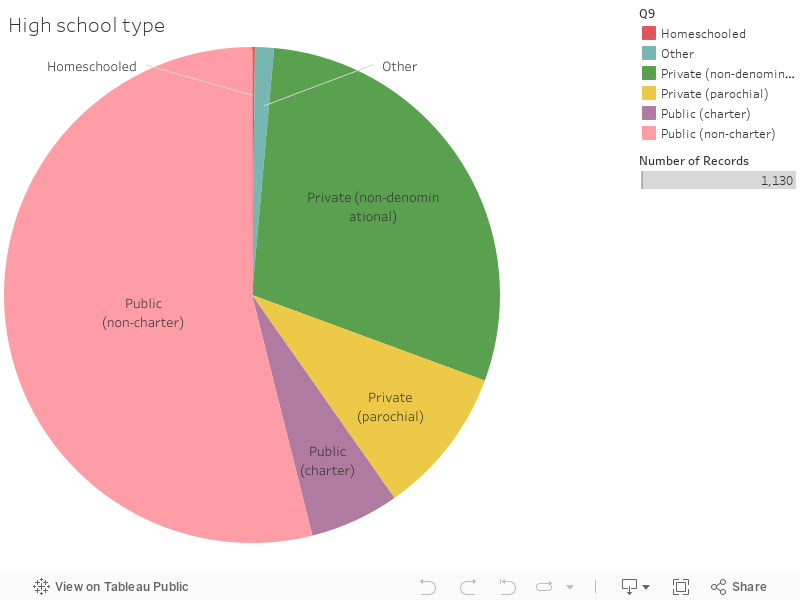
Fifty-four percent of students attended public high schools, while 29 percent attended private, non-denominational high schools. When asked to rank the enjoyment of their high school experience, the majority of respondents — 52 percent — said they enjoyed an “above-average” high school experience.
Willow Sylvester ’21, whose family has moved at least once a year since she was five years old, said she loved her high school experience because she was able to stay in one place and fully immerse herself in academics, extracurriculars and the social scene.
“My four years of high school probably couldn’t have gone better if I had scripted it,” she said. This fall, Sylvester is leaving Morse High School in Maine to become a member of Morse College.
And most members of the class of 2021 are moving onto campus only one summer removed from high school. Only 43 students, or four percent of respondents, took a gap year.
STUDENTS REPORT IMPROVED ACCESS TO FINANCIAL AID
The survey indicated a greater degree of socioeconomic diversity in the class of 2021 than in previous Yale classes. A little under one fifth of participants in the survey said that their legal guardians made under $65,000 a year, while 14 percent marked that their household incomes fell between $65,000 and $100,000, and around 15 percent of respondents said they came from households making more than $500,000. While the survey’s data still suggests the median household income of a Yale student is a great deal higher than the average American annual wage, it also marks an improvement from the level of income inequality at Yale identified by past studies. An analysis published by the New York Times earlier this year showed that between 2002 and 2014, more graduating Yalies came from the top 1 percent of the national income bracket than the entire bottom 60 percent (an income equal to or below $65,000). This did not hold true for those freshman who took this year’s survey.

Slightly more than 12 percent of students had a parent or grandparent that attended Yale, and about half of that number had a sibling who also attended or was attending Yale.
This year’s freshman survey also suggests that Yale’s financial aid program has improved its reach relative to years prior. The majority of survey-takers stated that financial aid was an important part of their college decision, and just over half of respondents said they received some form of financial assistance from Yale. Three quarters of those receiving financial aid said they were satisfied with their award, while less than 10 percent said they were not satisfied with their aid. Just under half of students who took the survey said they planned on seeking an on-campus job.
Additionally, according to the Office of Undergraduate Admissions, this year’s class includes 250 students who will be the first in their family to graduate from college, an uptick from the 206 in the class of 2020. The class of 2021 also includes 253 students eligible for a federal Pell grant for low-income students, more than the 214 in last year’s freshman class.
And while Yale spent $128 million on financial aid last year, Scott Wallace-Juedes, the inaugural Director of Undergraduate Financial Aid, reaffirmed the University’s commitment to financial aid in the face of expansion.
“As Yale College expands in size with students from all backgrounds, we look forward to extending our generous need-based financial aid policies to more students than ever,” Wallace-Juedes said. “We are continually committed to making the Yale education accessible and affordable to all of our admitted students.”
MOST INCOMING FIRST-YEARS HAVE NOT HAD SEX, DONE DRUGS
Incoming first-years reported experiences with drugs, alcohol and sexual encounters consistent with the findings of previous News surveys.
The most commonly used substance according to the survey was alcohol, with 45 percent of respondents reporting trying it at least once. Twenty-one percent reported using marijuana, 12 percent indicated having used tobacco, with less than 2 percent indicating having used cocaine and ecstasy, respectively. Still, 20 percent said they had tried none of these.
Sixty one percent said they had never had sexual intercourse. Of those who said they have had intercourse, 51 percent reported having had one sexual partner, and 19 percent indicated having had two. Thirteen percent of respondents reported having had more than five sexual partners.
Students also reported varying degrees of religious observance. Overall, members of the class of 2021 do not self-identify as very religious: 35 percent said they were not religious at all, while just under 4 percent said they were very religious. The 36 percent of students who said they did not usually observe a faith outnumbered those who said they planned to observe their faith on campus on their own time or by attending services.
THREE QUARTERS OF STUDENTS IDENTIFY AS LIBERAL
Levels of political activity in the class varied, with self-reported levels of political engagement running the gamut.
An overwhelming majority of respondents, 73 percent, describe themselves as somewhat or very liberal. Sixteen percent identify as moderate, while only around 10 percent consider themselves somewhat or very conservative. These numbers are consistent with the survey the News distributed to the entire student body last November in advance of the 2016 presidential election.
Fifty one percent of respondents said they were registered to vote in the US, 31 percent said they were not and 18 percent said they were not eligible — slightly lower figures than the schoolwide average, according to the October 2016 survey.
Of those registered, 66 percent said they did not vote in the 2016 election, while 27 percent voted for Hillary Clinton LAW ’73 and 4 percent for Donald Trump.
When asked if they thought they had become more or less politically engaged since the election, half of respondents said they had become moderately more engaged. A smaller but substantial 24 percent said they had become significantly more engaged, and 18 percent reported no change.
Contact LUKE CIANCARELLI at luke.ciancarelli@yale.edu and RACHEL TREISMAN at rachel.treisman@yale.edu .
Credits
Powered by